 by
by AI Spreadsheet Tools for Business Analysis: Practical Workflows, Limits and Safe Use
Spreadsheets remain one of the most important tools in business because they sit close to the actual work: sales lists, budgets, forecasts, inventory, survey results, project trackers and operational reports. AI is changing how people interact with those files. Instead of remembering a complicated formula or building every PivotTable manually, a user can describe the result they want in normal language and ask an AI assistant to help create, explain or analyze it.
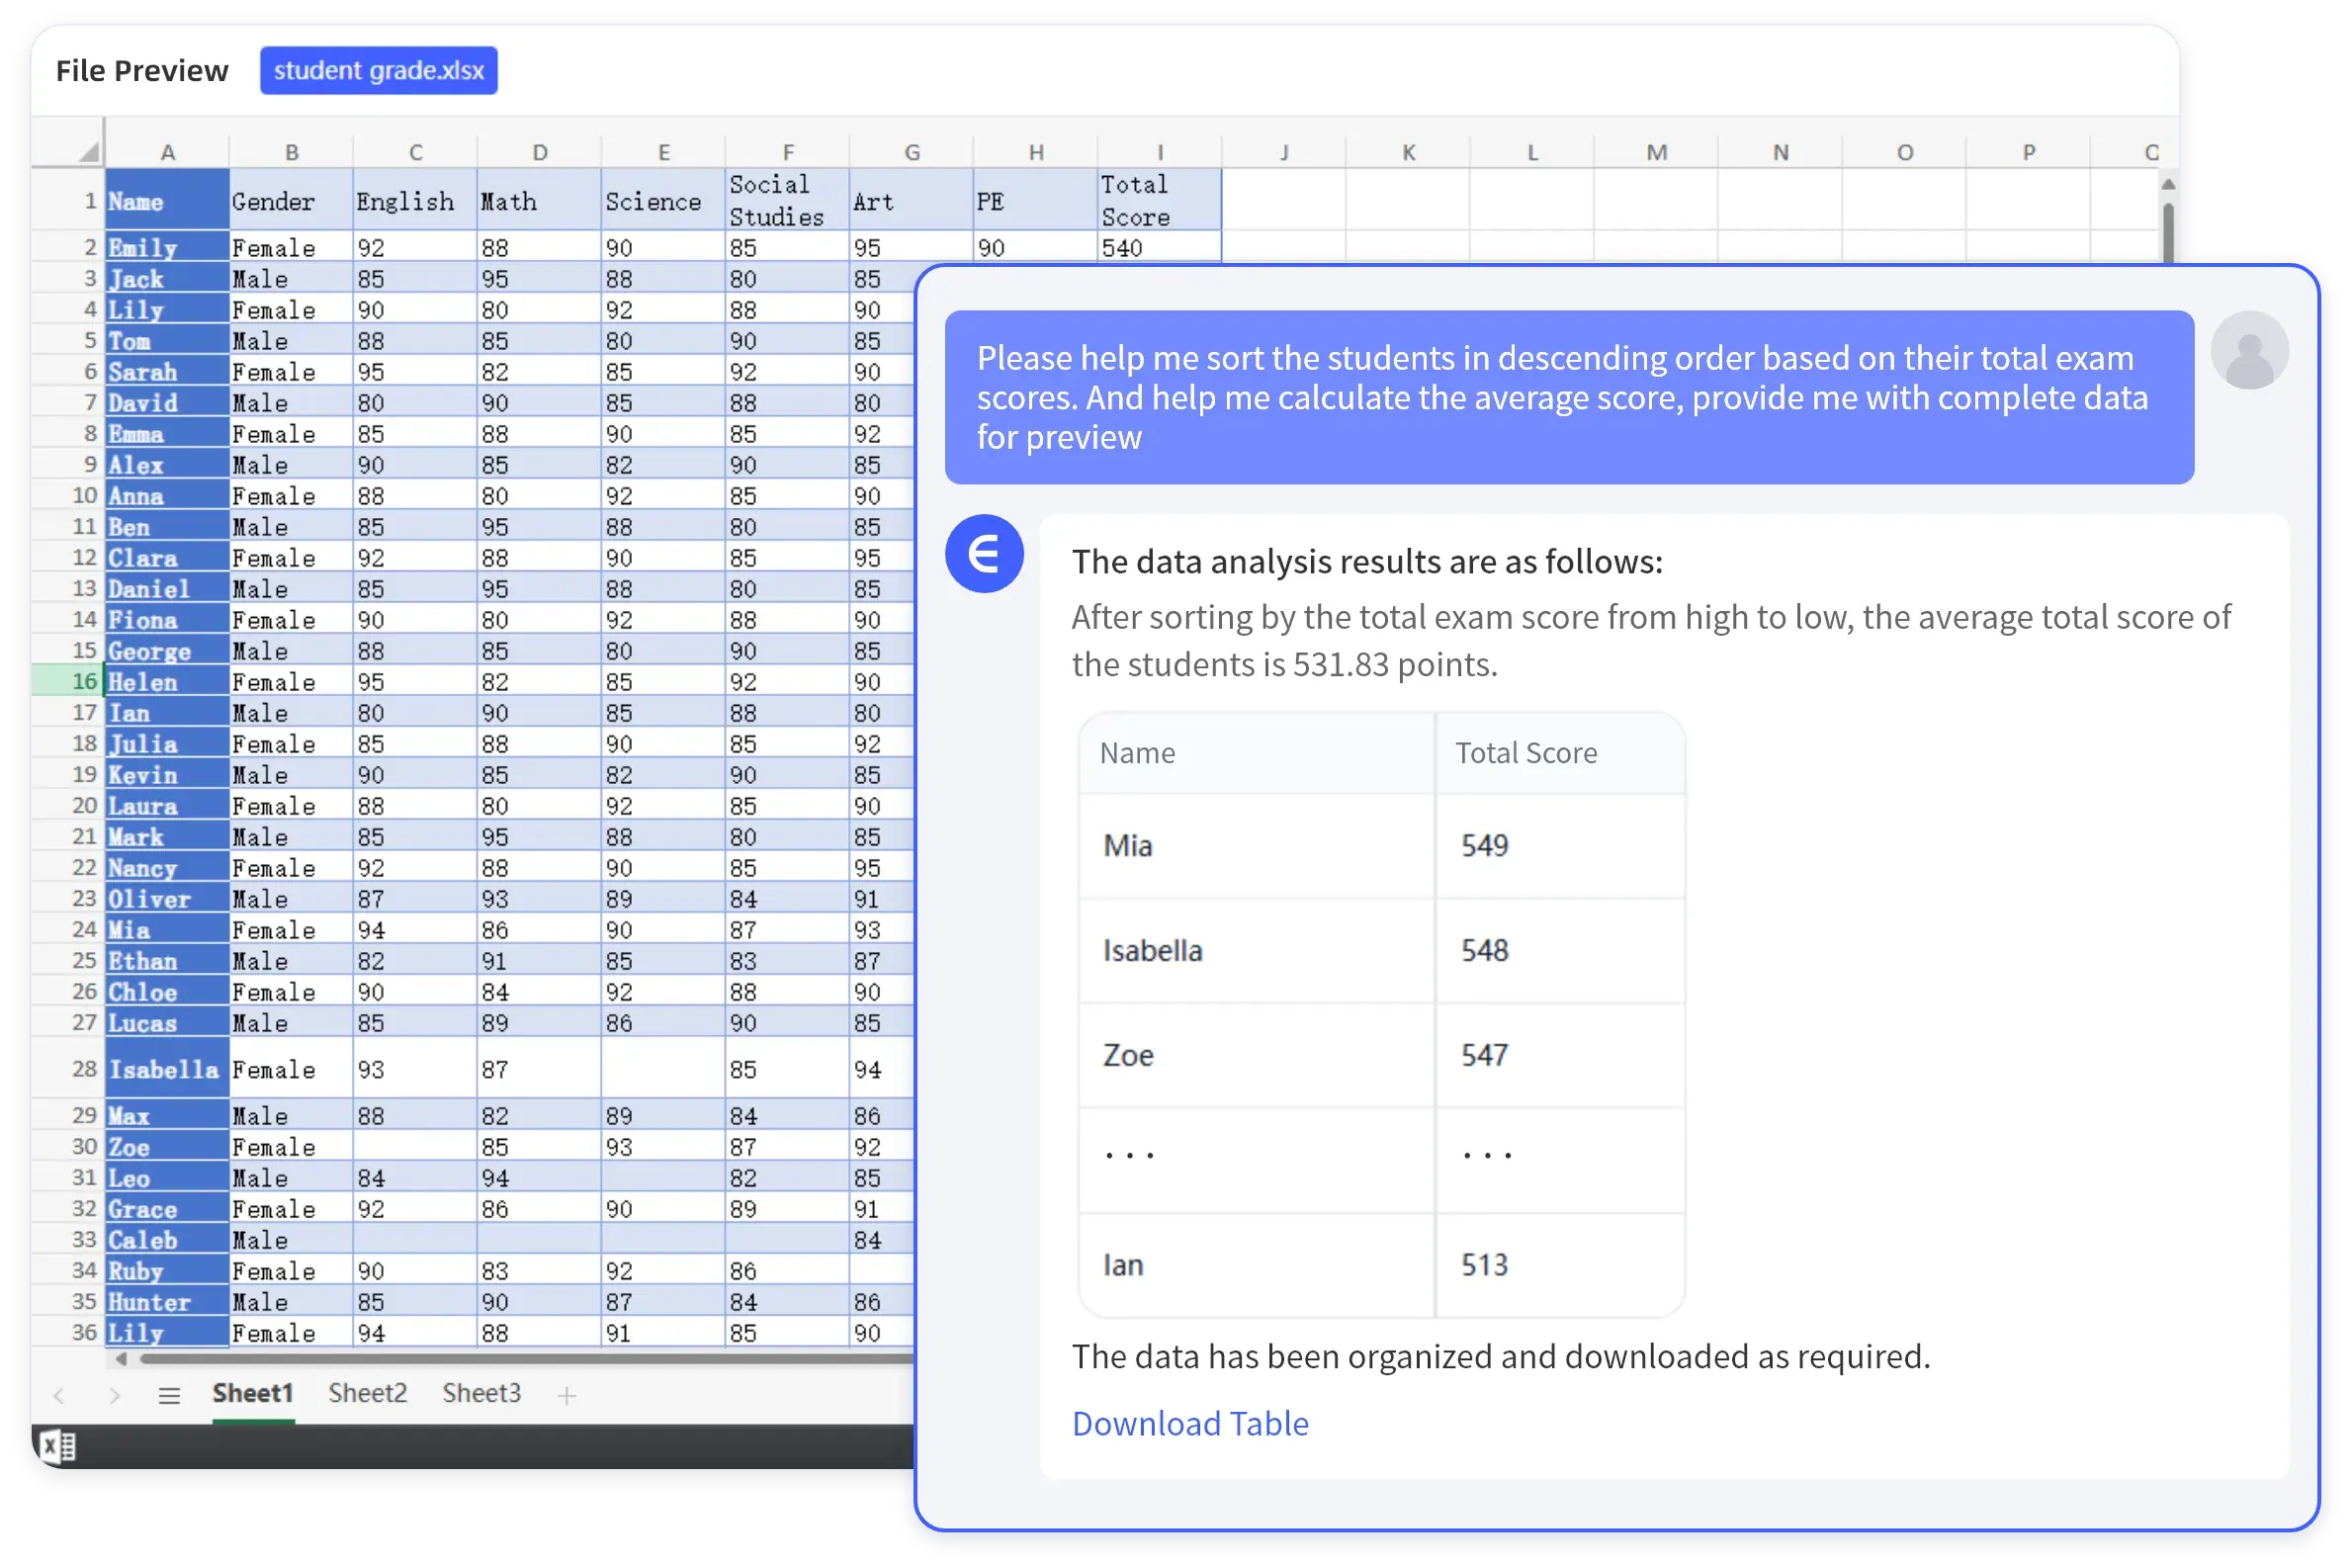
That sounds simple, but AI spreadsheet tools are most useful when they are treated as assistants inside a controlled analysis process—not as replacements for clean data, business context or verification. A generated chart can look convincing while using the wrong column. A formula can be syntactically valid while applying the wrong assumption. A summary can correctly describe a trend but miss a data-quality problem that changes the conclusion.
This guide explains how to use AI spreadsheet tools for business analysis in a way that saves time while preserving traceability, accuracy and human judgment.
What AI Spreadsheet Tools Can Do in 2026
Modern spreadsheet assistants can do more than suggest formulas. Microsoft documents Copilot in Excel capabilities that include creating and editing worksheets, generating formulas, creating charts and PivotTables, sorting and filtering information and surfacing trends or outliers. Google documents Gemini in Sheets features that can build or edit spreadsheets, generate content, categorize information and perform analysis tasks from natural-language requests.
See the current official documentation for Copilot in Excel and Gemini in Google Sheets for product-specific availability and supported features.
Common AI-assisted spreadsheet tasks
- Explain an unfamiliar formula.
- Create a formula from a plain-language requirement.
- Summarize trends in a data table.
- Find potential outliers.
- Create charts or PivotTables.
- Categorize text such as survey comments.
- Generate a new calculated column.
- Restructure a table into a more useful format.
- Draft a short management summary from validated results.
The important phrase is validated results. Microsoft’s own support documentation reminds users to review, edit and verify AI-generated content. That principle should become part of your normal workflow.
Good AI Analysis Starts With Clean Spreadsheet Structure
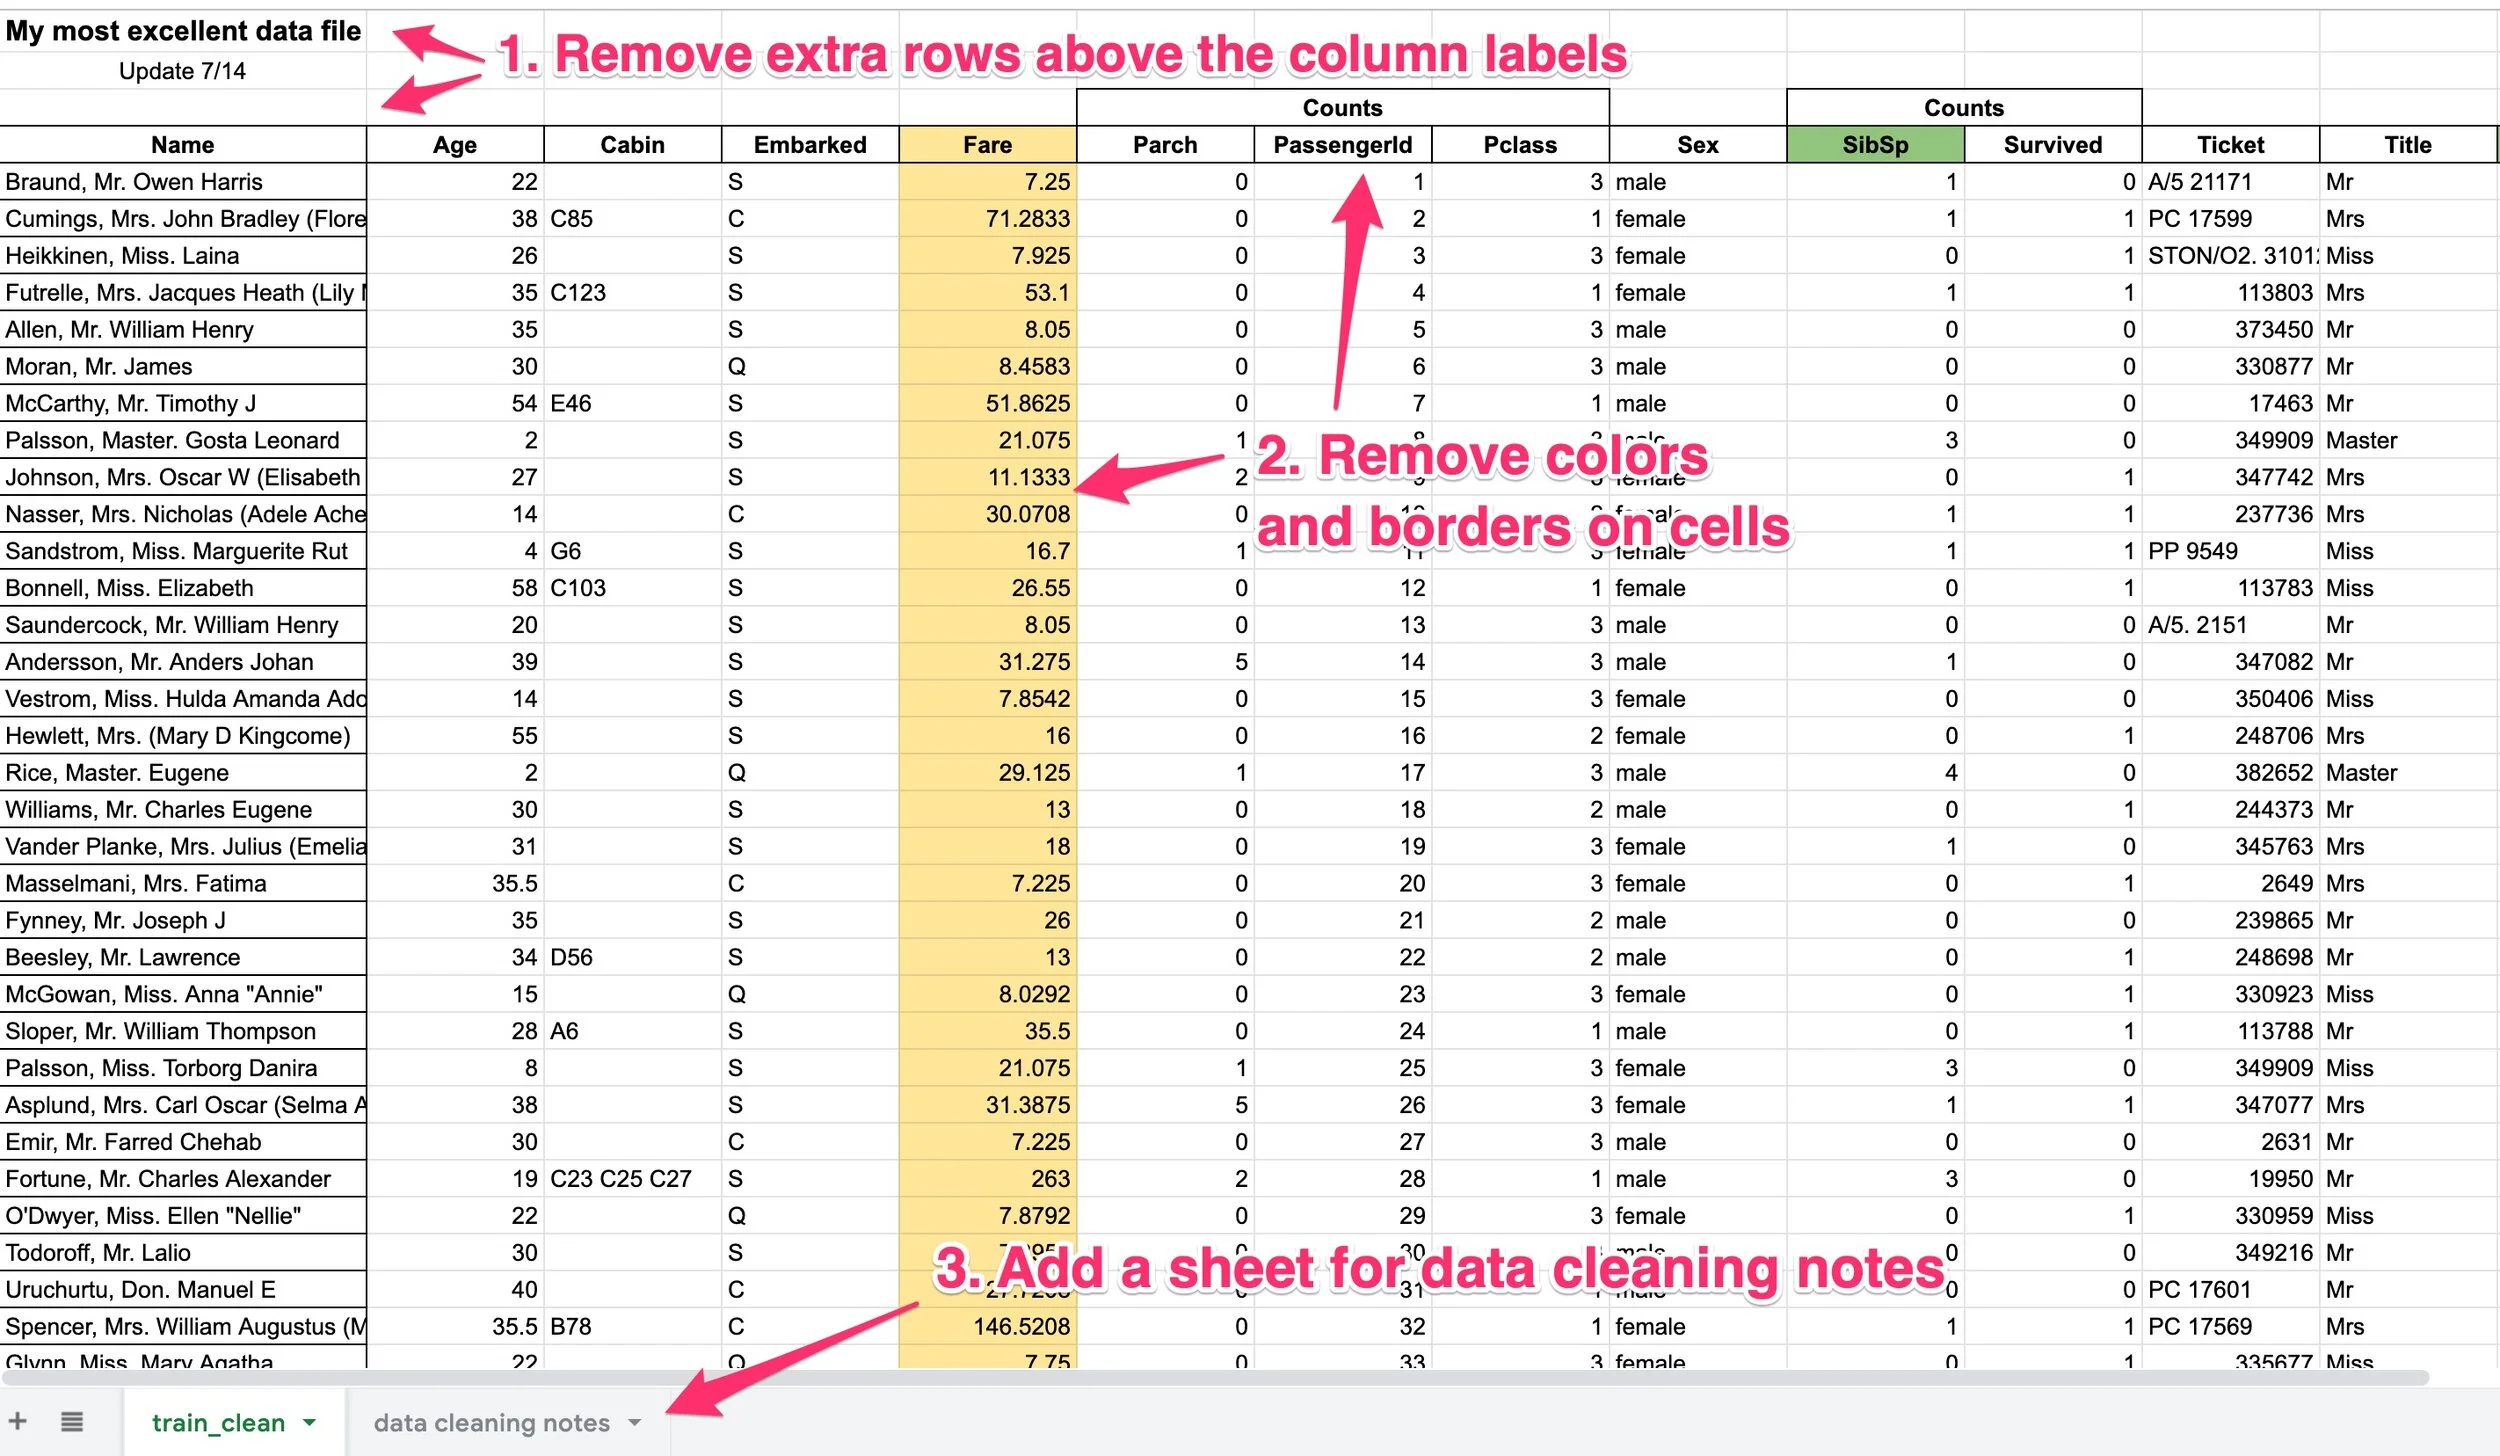
An AI assistant cannot reliably repair every structural problem in a workbook. If a spreadsheet mixes titles, totals, comments, merged cells and several unrelated tables in one range, the system has to guess what the data means. The same is true for a human analyst.
Prepare the data before asking for insights
- Use one row for one record. A sales table should normally have one row per order or transaction.
- Use clear column headings. “Revenue_USD” is easier to interpret than “Value 2.”
- Keep data types consistent. A date column should not contain notes such as “not confirmed.”
- Separate raw data from summaries. Keep calculated reports on another sheet when possible.
- Remove accidental duplicates. Do not let duplicate rows create a false trend.
- Document units. Make it clear whether a figure represents dollars, percentages, minutes or quantities.
Microsoft’s Analyze Data guidance also notes that structured, tabular data produces better analysis. Clean structure is not busywork; it reduces ambiguity for both people and AI systems.
Use AI for Exploration Before You Use It for Decisions
One of the strongest uses for AI in spreadsheets is exploratory analysis. You can ask broad questions, discover possible patterns and decide which areas deserve deeper investigation.
Useful exploratory prompts
- “Show monthly revenue and highlight unusually large changes.”
- “Which product categories have declining unit sales but rising revenue?”
- “Create a PivotTable showing support tickets by category and month.”
- “List possible duplicate customers based on email and phone fields.”
- “Summarize the most common themes in the customer comments column.”
These prompts are useful because they create a starting point, not a final business decision. If the AI identifies an outlier, inspect the source rows. If it proposes a formula, review the references. If it creates a chart, confirm that the aggregation and scale match the question.
For teams that are expanding AI across daily workflows, our guide to AI productivity apps for everyday work covers similar review principles outside spreadsheets.
Formula Generation Is Powerful but Easy to Misuse
AI assistants can reduce the time required to remember formula syntax. A user can describe a calculation and receive a formula using functions such as XLOOKUP, SUMIFS, IF, FILTER or date functions. But a formula can be technically correct and still represent the wrong business rule.
Example: gross margin
Imagine asking an AI assistant to “calculate margin.” Does that mean gross profit divided by revenue, markup divided by cost, contribution margin after variable expenses, or a company-specific definition? The spreadsheet assistant cannot know unless the user provides context.
A safer formula workflow
- Describe the business definition in words.
- Ask the AI to explain the proposed formula.
- Test it on three to five rows where you already know the answer.
- Check absolute and relative cell references.
- Confirm blank, zero and error behavior.
- Only then fill the formula across the full data range.
This small verification step prevents a subtle formula error from being copied across thousands of rows.
Charts Need a Question, Not Just Attractive Formatting
AI can build a chart quickly, but visual quality is not the same as analytical quality. A chart should answer a specific question.
| Question | Possible visual | Common mistake |
|---|---|---|
| How has revenue changed over time? | Line chart | Mixing cumulative and monthly values |
| Which categories contribute most? | Sorted bar chart | Using too many small categories |
| Is there a relationship between two measures? | Scatter plot | Assuming correlation proves cause |
| How does actual compare with target? | Variance table or bar chart | Using inconsistent baselines |
| Where are the outliers? | Scatter or distribution view | Removing unusual values without investigation |
Ask the AI why it chose the visual and what aggregation it used. If the chart cannot be explained clearly, do not use it in an executive report simply because it looks polished.
Build a Reproducible Analysis Process
A good business analysis should be possible to repeat next week or next month. That becomes difficult if the entire process exists only as a conversation with an AI assistant.
Keep the transformation visible
- Prefer formulas, query steps or documented transformations over unexplained pasted values.
- Keep raw data unchanged in a separate sheet.
- Add a “Read Me” or methodology sheet for important workbooks.
- Record the date and source of imported information.
- Save the final prompt or instructions for recurring AI-assisted tasks.
- Note manual adjustments that cannot be recreated automatically.
If an AI tool directly edits a workbook, review the changed cells rather than trusting a verbal summary of what it did. Microsoft’s current Excel documentation emphasizes that users remain in control of workbook modifications; your process should preserve that control.
Handle Sensitive Data Before It Reaches an AI Feature

Spreadsheets often contain more sensitive information than people realize: salaries, customer details, financial forecasts, addresses, health-related information, contract prices or internal performance metrics. Before enabling an AI feature, understand what data it can access and how the provider handles that information.
The NIST Privacy Framework provides a useful risk-management approach for organizations that need to identify and manage privacy risks. For AI-specific governance, the NIST AI Risk Management Framework provides additional principles around reliability, transparency and privacy-enhanced systems.
Practical data-minimization steps
- Do not upload fields that are unnecessary for the analysis.
- Replace personal identifiers with internal IDs where possible.
- Use organization-approved AI features for confidential work.
- Separate public market data from private customer information.
- Limit workbook sharing to people who need access.
- Delete temporary exports after the analysis is complete.
AI Spreadsheet Tools Are Not Financial, Legal or Medical Authorities
A spreadsheet assistant can calculate or summarize information, but it does not become a qualified professional because the output appears inside a familiar workbook. Sensitive decisions need domain review.
For example, an AI may calculate a tax estimate correctly from the numbers provided while missing an accounting rule that was never represented in the sheet. It may summarize employee performance data while ignoring the fairness implications of the underlying metrics. It may analyze medical survey data but cannot replace clinical expertise.
Use AI to reduce mechanical work and accelerate exploration. Keep responsibility for high-impact decisions with people who understand the relevant domain.
A Practical AI Spreadsheet Workflow
- Define the business question. Write down what you are trying to learn.
- Prepare the data. Clean headings, types, duplicates and missing values.
- Ask for an exploratory analysis. Look for trends, distributions and anomalies.
- Inspect the evidence. Trace conclusions back to source rows.
- Create calculations. Verify formulas on known examples.
- Build visuals. Use charts only when they answer a clear question.
- Review sensitive information. Confirm the data is appropriate for the AI tool.
- Document the process. Save formulas, methodology and key prompts.
- Get human sign-off. Review business-critical outputs before action.
For more complex AI-supported research, see our guide to AI research assistants and source verification.
AI Spreadsheet Tool Evaluation Checklist
- Works with your existing spreadsheet format.
- Can explain changes before or after applying them.
- Supports formulas and charts you actually use.
- Provides a way to inspect source data behind conclusions.
- Has clear permissions and organization controls.
- Fits your data-handling requirements.
- Does not force unnecessary data into a separate workflow.
- Allows easy undo, version history or recovery.
- Produces results that can be verified manually.
- Has predictable licensing and usage costs.
Frequently Asked Questions
Can AI replace spreadsheet formulas?
No. AI can generate and explain formulas, but formulas remain valuable because they make calculations visible and repeatable. For recurring analysis, a verified formula is often more dependable than asking the same question from scratch every time.
Are AI spreadsheet insights always correct?
No. They depend on the quality of the source data, the question, the selected range and the model’s interpretation. Important insights should be checked against the underlying rows and calculations.
Should a small business use AI for financial spreadsheets?
AI can help with organization, formulas, summaries and exploratory analysis, but accounting, tax and financial decisions should still be reviewed by someone with appropriate expertise.
What is the best first use case?
Start with a low-risk, repetitive task such as cleaning a monthly report, explaining formulas or creating a first-pass summary. That provides measurable time savings without placing a critical decision fully in the hands of an AI system.
Conclusion
AI spreadsheet tools can make business analysis faster by turning natural-language instructions into formulas, charts, summaries and structured edits. Their value is highest when they reduce mechanical work while keeping the analysis transparent.
Clean the data before asking for insight, verify formulas on known examples, inspect the rows behind important conclusions and document recurring workflows. Treat privacy and sensitive data as design requirements rather than afterthoughts. With those habits, AI can make spreadsheets easier to use without turning a familiar business tool into an opaque decision system.